RegulonDB
MetR matrix and aligment
matrix-quality result
Command: matrix-quality -v 1 -ms ./data/Matrices_NR/MetR/MetR.EcolK12_2nt_upstream.18.meme
Figures
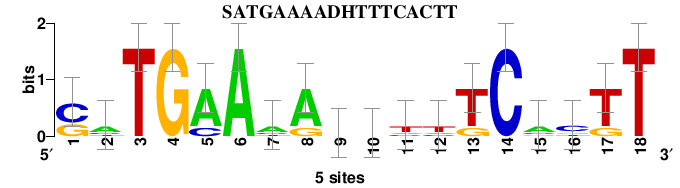
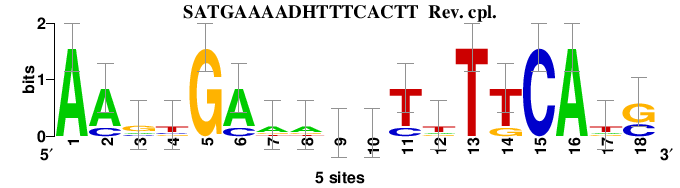
Matrix logo
Decreasing cumulative distributions (dCDF)
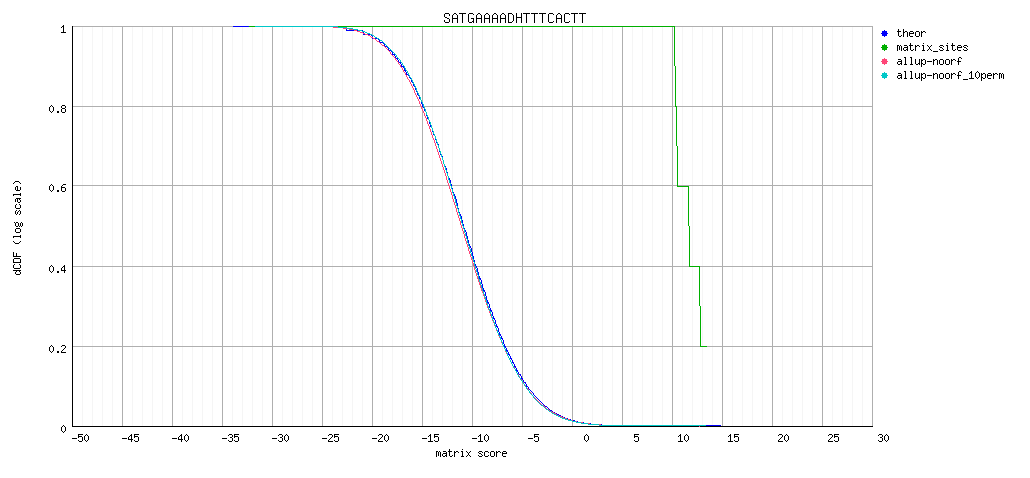
Decreasing cumulative distributions (dCDF), logarithmic Y axis

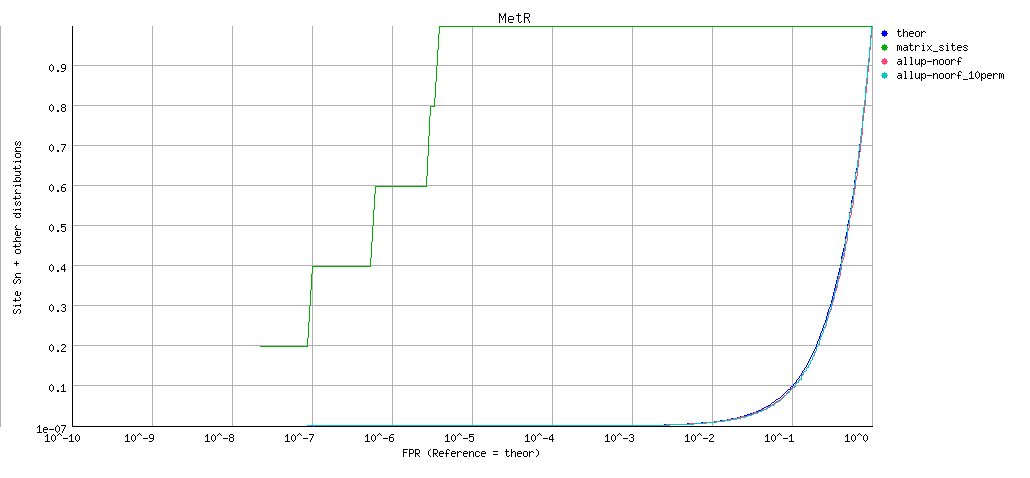
ROC curve (logarithmic X axis)
Matrix information
; convert-matrix  -v 1 -from transfac -i /MetR.EcolK12_2nt_upstream.18.meme_quality_logo
; Input files
;	input	/MetR.EcolK12_2nt_upstream.18.meme_quality_matrix.tf
;	prior	/MetR.EcolK12_2nt_upstream.18.meme_quality2nt_upstream-noorf_Escherichia_coli_GCF_000005845.2_ASM584v2-ovlp-1str.freq.gz_inclusive.tab
; Input format        	transfac
; Output files
;	output	/MetR.EcolK12_2nt_upstream.18.meme_quality_matrix_info.txt
; Output format       	tab
; pseudo-weight       	1
; Background model
;	Strand        	undef
;	Background pseudo-frequency	0.01
;	Residue probabilities
;		a	0.29114
;		c	0.20781
;		g	0.20402
;		t	0.29702
A	0	3	0	0	4	5	3	4	2	2	1	1	0	0	3	0	0	0
C	3	1	0	0	1	0	1	0	0	1	1	1	0	5	1	3	0	0
G	2	0	0	5	0	0	0	1	1	0	0	0	1	0	1	1	1	0
T	0	1	5	0	0	0	1	0	2	2	3	3	4	0	0	1	4	5
//
A  0.0  0.5  0.0  0.0  0.7  0.9  0.5  0.7  0.4  0.4  0.2  0.2  0.0  0.0  0.5  0.0  0.0  0.0
C  0.5  0.2  0.0  0.0  0.2  0.0  0.2  0.0  0.0  0.2  0.2  0.2  0.0  0.9  0.2  0.5  0.0  0.0
G  0.4  0.0  0.0  0.9  0.0  0.0  0.0  0.2  0.2  0.0  0.0  0.0  0.2  0.0  0.2  0.2  0.2  0.0
T  0.0  0.2  0.9  0.0  0.0  0.0  0.2  0.0  0.4  0.4  0.5  0.5  0.7  0.0  0.0  0.2  0.7  0.9
//
A -1.8  0.6 -1.8 -1.8  0.9  1.1  0.6  0.9  0.3  0.3 -0.3 -0.3 -1.8 -1.8  0.6 -1.8 -1.8 -1.8
C  0.9 -0.0 -1.8 -1.8 -0.0 -1.8 -0.0 -1.8 -1.8 -0.0 -0.0 -0.0 -1.8  1.4 -0.0  0.9 -1.8 -1.8
G  0.6 -1.8 -1.8  1.4 -1.8 -1.8 -1.8 -0.0 -0.0 -1.8 -1.8 -1.8 -0.0 -1.8 -0.0 -0.0 -0.0 -1.8
T -1.8 -0.3  1.1 -1.8 -1.8 -1.8 -0.3 -1.8  0.3  0.3  0.6  0.6  0.9 -1.8 -1.8 -0.3  0.9  1.1
//
A -0.1  0.3 -0.1 -0.1  0.6  1.0  0.3  0.6  0.1  0.1 -0.1 -0.1 -0.1 -0.1  0.3 -0.1 -0.1 -0.1
C  0.5 -0.0 -0.1 -0.1 -0.0 -0.1 -0.0 -0.1 -0.1 -0.0 -0.0 -0.0 -0.1  1.2 -0.0  0.5 -0.1 -0.1
G  0.2 -0.1 -0.1  1.3 -0.1 -0.1 -0.1 -0.0 -0.0 -0.1 -0.1 -0.1 -0.0 -0.1 -0.0 -0.0 -0.0 -0.1
T -0.1 -0.1  1.0 -0.1 -0.1 -0.1 -0.1 -0.1  0.1  0.1  0.3  0.3  0.6 -0.1 -0.1 -0.1  0.6  1.0
//
; Sites	5
>site_0
GATGCAAATTTTTCACTT
>site_1
CATGAAAGTCCTTCACTT
>site_2
CATGAATAATTTGCGCTT
>site_3
CCTGAAAAGAAATCCGTT
>site_4
GTTGAACAAATCTCATGT
;
; Matrix parameters
;	Number of sites              	5
;	Columns                      	18
;	Rows                         	4
;	Alphabet                     	A|C|G|T
;	Prior                        	A:0.291144263562772|C:0.207810681831126|G:0.204024081631615|T:0.297020972974487|a:0.291144263562772|c:0.207810681831126|g:0.204024081631615|t:0.297020972974487
;	program                      	transfac
;	matrix.nb                    	1
;	accession                    	SATGAAAADHTTTCACTT
;	AC                           	SATGAAAADHTTTCACTT
;	id                           	SATGAAAADHTTTCACTT
;	name                         	SATGAAAADHTTTCACTT
;	description                  	saTGaAaawwtttCactT
;	statistical_basis            	5 sequences
;	sites                        	5
;	nb_sites                     	5
;	min.prior                    	0.204024
;	alphabet.size                	4
;	max.bits                     	2
;	total.information            	8.46606
;	information.per.column       	0.470337
;	max.possible.info.per.col    	1.58952
;	consensus.strict             	caTGaAaaaatttCactT
;	consensus.strict.rc          	AAGTGAAATTTTTTCATG
;	consensus.IUPAC              	saTGaAaawwtttCactT
;	consensus.IUPAC.rc           	AAGTGAAAWWTTTTCATS
;	consensus.regexp             	[cg]aTGaAaa[at][at]tttCactT
;	consensus.regexp.rc          	AAGTGAAA[AT][AT]TTTTCAT[CG]
;	residues.content.crude.freq  	a:0.3111|c:0.2000|g:0.1444|t:0.3444
;	G+C.content.crude.freq       	0.344444
;	residues.content.corrected.freq	a:0.3078|c:0.2013|g:0.1544|t:0.3365
;	G+C.content.corrected.freq   	0.355676
;	min(P(S|M))                  	1.2007e-26
;	max(P(S|M))                  	0.000283399
;	proba_range                  	0.000283399
;	Wmin                         	-32.3
;	Wmax                         	15.3
;	Wrange                       	47.6
; logo file:/MetR.EcolK12_2nt_upstream.18.meme_quality_logo_m1.png
; logo file:/MetR.EcolK12_2nt_upstream.18.meme_quality_logo_m1_rc.png
;
; Host name	sinik
; Job started	2019-06-03.161014
; Job done	2019-06-03.161015
; Seconds	0.54
;	user	0.54
;	system	0.05
;	cuser	0.43
;	csystem	0.04